Under the Pollsters’ Radar
At this stage of the election cycle we are drowning in polls. While each media outlet treats its own commissioned research as holy writ, they all have their own strengths and weaknesses, and it takes something like Danyl McLauchlan’s tracking poll charts to smooth out the noise and calibrate them against actual election results. Even with that, there’s a growing problem with traditional polling: it only reaches people with landlines.
Polling cellphones is difficult, and some pollsters think that the resulting bias isn’t such a big issue, using demographic weighting in an attempt to compensate. However, there are other academics and polling companies who acknowledge that it is troubling. For instance, statistician Dr Andrew Balemi has been quoted by Colmar Brunton as saying “the fact that not all households have landlines is an increasing concern with CATI [computer-aided interviewing]. However, in the absence of any substantiated better technique, CATI interviewing remains the industry standard.” That leaves a growing number of people (about 15% of households) out of the poll results.
That wouldn’t be a problem if this omission were evenly distributed. However, while there’s debate about how significant the bias is, landline-free households do tend to be younger and less well off. I decided to see whether there were also geographic variations, by mapping the proportion of households without landlines.

This is based on the somewhat ambiguously-worded Access to Telecommunications Systems question in the 2013 Census (officially, the “telephone” answer is intended to mean a landline, though it could easily be misinterpreted). With that proviso, some geographic patterns are obvious. In most of the outer suburbs, fewer than a quarter of households eschew a fixed line. This proportion increases in the inner suburbs, and in the central city, landlines are an endangered species. Given that this is the most densely populated part of the city, this is significant, so let’s zoom in to Te Aro for some more detail.
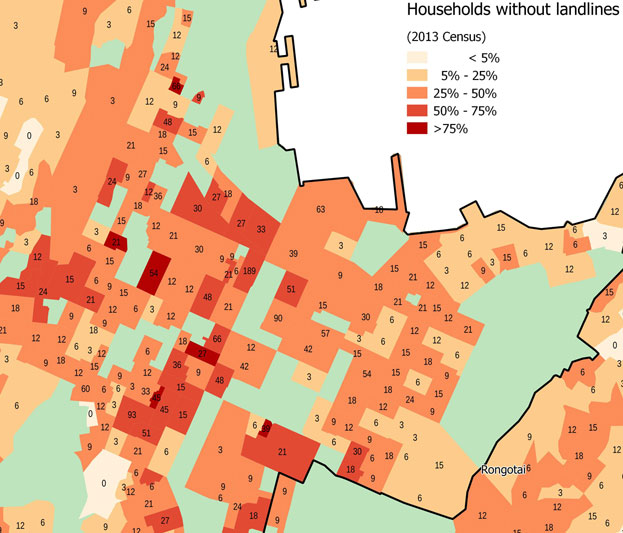
As well as shading the meshblocks with the proportion, this labels them with the approximate number of households that lack fixed-line phones (Stats NZ randomly rounds the data to base 3 for privacy reasons). One single block has nearly 200 of these (that would be the Soho apartment building), and looking at the numbers it’s clear these would add up quickly. A large proportion of these homes would have more than one adult occupant, so there’s a whole community of city dwellers whose voices are going unheard in the polls.
Some have argued that people without landlines also tend to be the people who don’t vote, and that’s certainly consistent with enrolment patterns suggesting that young, mobile people are less likely to enrol. There’s likely to be some influence from the fact that Te Aro has a lot of new apartments: when moving into a brand new place without an existing landline it’s easy to keep it that way, whereas people in long-established homes would have to make a conscious decision to change. Settled households with older inhabitants in Karori, Johnsonville and Seatoun are much more likely to be polled than the young, dynamic population of the central city. Inner-city issues, priorities and aspirations go unheard, and the voice of the polls is the voice of the suburbs.
Of course, there is still one way to guarantee that your voice will count, even if the pollsters can’t hear it. Vote.
It’s not that pollsters think landline non-coverage isn’t a big issue. It’s that there are much bigger issues. What about the fact that polls that select ‘one person per household’ are biased toward those in smaller households? What about the fact that 35–40% refuse to take part? These issues are much *much* bigger than the landline coverage issue, and they have been around for a lot longer too.
Yet, somehow pollsters manage to understand these issues enough to compensate for them. The potential sources of error in a poll are infinate. If you just point to one potential source, you’re barely scraping the surface.
The pollster’s job is not to get a perfectly representative sample. That is not even possible. The pollster’s job is to understand why they can’t.
This post explains a bit more about error in polls. Landline coverage is just one of the many things pollster’s need to consider.
Error in polls and surveys:
https://grumpollie.wordpress.com/2013/03/24/error-in-polls-and-surveys‑2/
Many thanks for that, Andrew. I’ve been learning a lot about the complexities of polling from your posts, and I’ve got a lot more to learn.
One of the things I’m trying to work out is the degree to which various issues introduce a systematic bias that might affect voting choice responses. Do non-responses and response bias have a known effect in favouring or missing particular demographics?
I guess there are a few reasons why the landline issue gets raised so often. One is that unlike some of the other sources of error you mention, it is changing rapidly, so we don’t know to what extent the errors in the polls might be growing. The other is that most of my peers are in the landline-free cohort, and that coincides with our liberal bubble. We know hardly anyone who gets polled, and at the same time we know hardly anyone on the right of the political spectrum. Thus, it’s easy to think that our voices aren’t being heard in the polls, and to believe that there might be a strong undercurrent of progressive voters who don’t show up in the polls that present National as being comfortably ahead.
That’s obviously an unscientific observation, but it’s a powerful narrative. My maps won’t show to what extent it could be true: I was just trying to investigate the extent to which there’s a geographic as well as a demographic pattern to non-landline households. Of course, the two are closely linked, but I think it’s worth investigating the apparent bias of polled people towards the suburbs and against the inner city. As you say, that might be swamped by all the other sources of error, but mapping this distribution still seems to show one more dimension of potential polling bias.
Non-response/response bias has a varying impact at different times in the election cycle, and due to different kinds of events. This is something pollsters think about when they examine and weight their data (if they do). In my view non-response is the biggest problem facing polls. The methodology I employ is designed principally with this in mind.
Landline coverage is changing, sure. Methodologies will likely change too at some point. A lot of people assume calling calls is the right way to go, but then you have abysmal reponse rates and difficulties ensuring good geographic representation. There may be other solutions. If I thought there was a more robust solution than the one I’m using at present, I’d change it in a second. The company I work for surveys people on cells, door-to-door, online, via txt (you name it). I would use any or all combinations of these methods if I thought they’d provide more robust results.
I understand your experience – I lived in a similar liberal bubble while working in academia, and even now none of my friends or colleagues are voting right (that I know of). A couple of things though. Firstly, the likelihood of being polled is low. I’ve had a landline all my life and I’ve been polled only once, 9 years ago. Secondly, nobody knows a representative group of people. Even if you know people from all ages and ethnic groups, we differ in more ways than our age and ethnicity. Factors like socialisation and worldview are, in my view, much more important contributors to voting choice than age, gender and ethnicity. Probability sampling is an attempt to draw a sample that is representative by the known as well as the unknown factors. Yes there are demographic biases, and pollsters need to make a careful decision over how to adjust for them. Demographic biases are not the only ones to consider though.
Some polling companies will target certain numbers by age, gender, ethnicity, and region to make sure the sample matches the Census (quota sampling). Others will opt for a random sample and weight the results (probability sampling). There are pros and cons to each approach, and they both asumme the people you have sampled are similar to the people you have not sampled. That’s a big assumption, and one pollsters need to be concerned about.
I do appreciate the power of the narrative. I think your maps a great.
(Typed this on an iPad, so excuse typos.)
Haven’t had a landline for years and I vote every election
Perhaps the rise of naked broadband lines in an area will prompt pollsters to go back to the traditional door to door sampling method – people still have to live somewhere with or without a landline
That’s an interesting point. However, it might still miss a lot of apartment-dwellers, in the way that Census data-gatherers had to go to extra lengths to make sure they were all captured. There’s a whole variety of security and intercom systems to negotiate (I had no intercom at my last apartment, since it needed a landline), and people in inner city apartments are more likely to be out in the evenings.
Another interesting article, Tom. Keep them coming.
Also there is a high refusal rate (won’t answer) and I don’t see that being widely reported